“Ridge to reef” is an environmental planning concept — what happens inland eventually reaches the coast. Rain carries sediment. Rivers carry waste. The ocean receives everything. GIZ commissioned waste characterization visuals across three Southeast Asian sites: a tourist town, a remote UNESCO reef, and a river city whose drainage flows straight to sea.
Each location had different data, different geometry, and a different story. All three had to feel like the same document.
Process
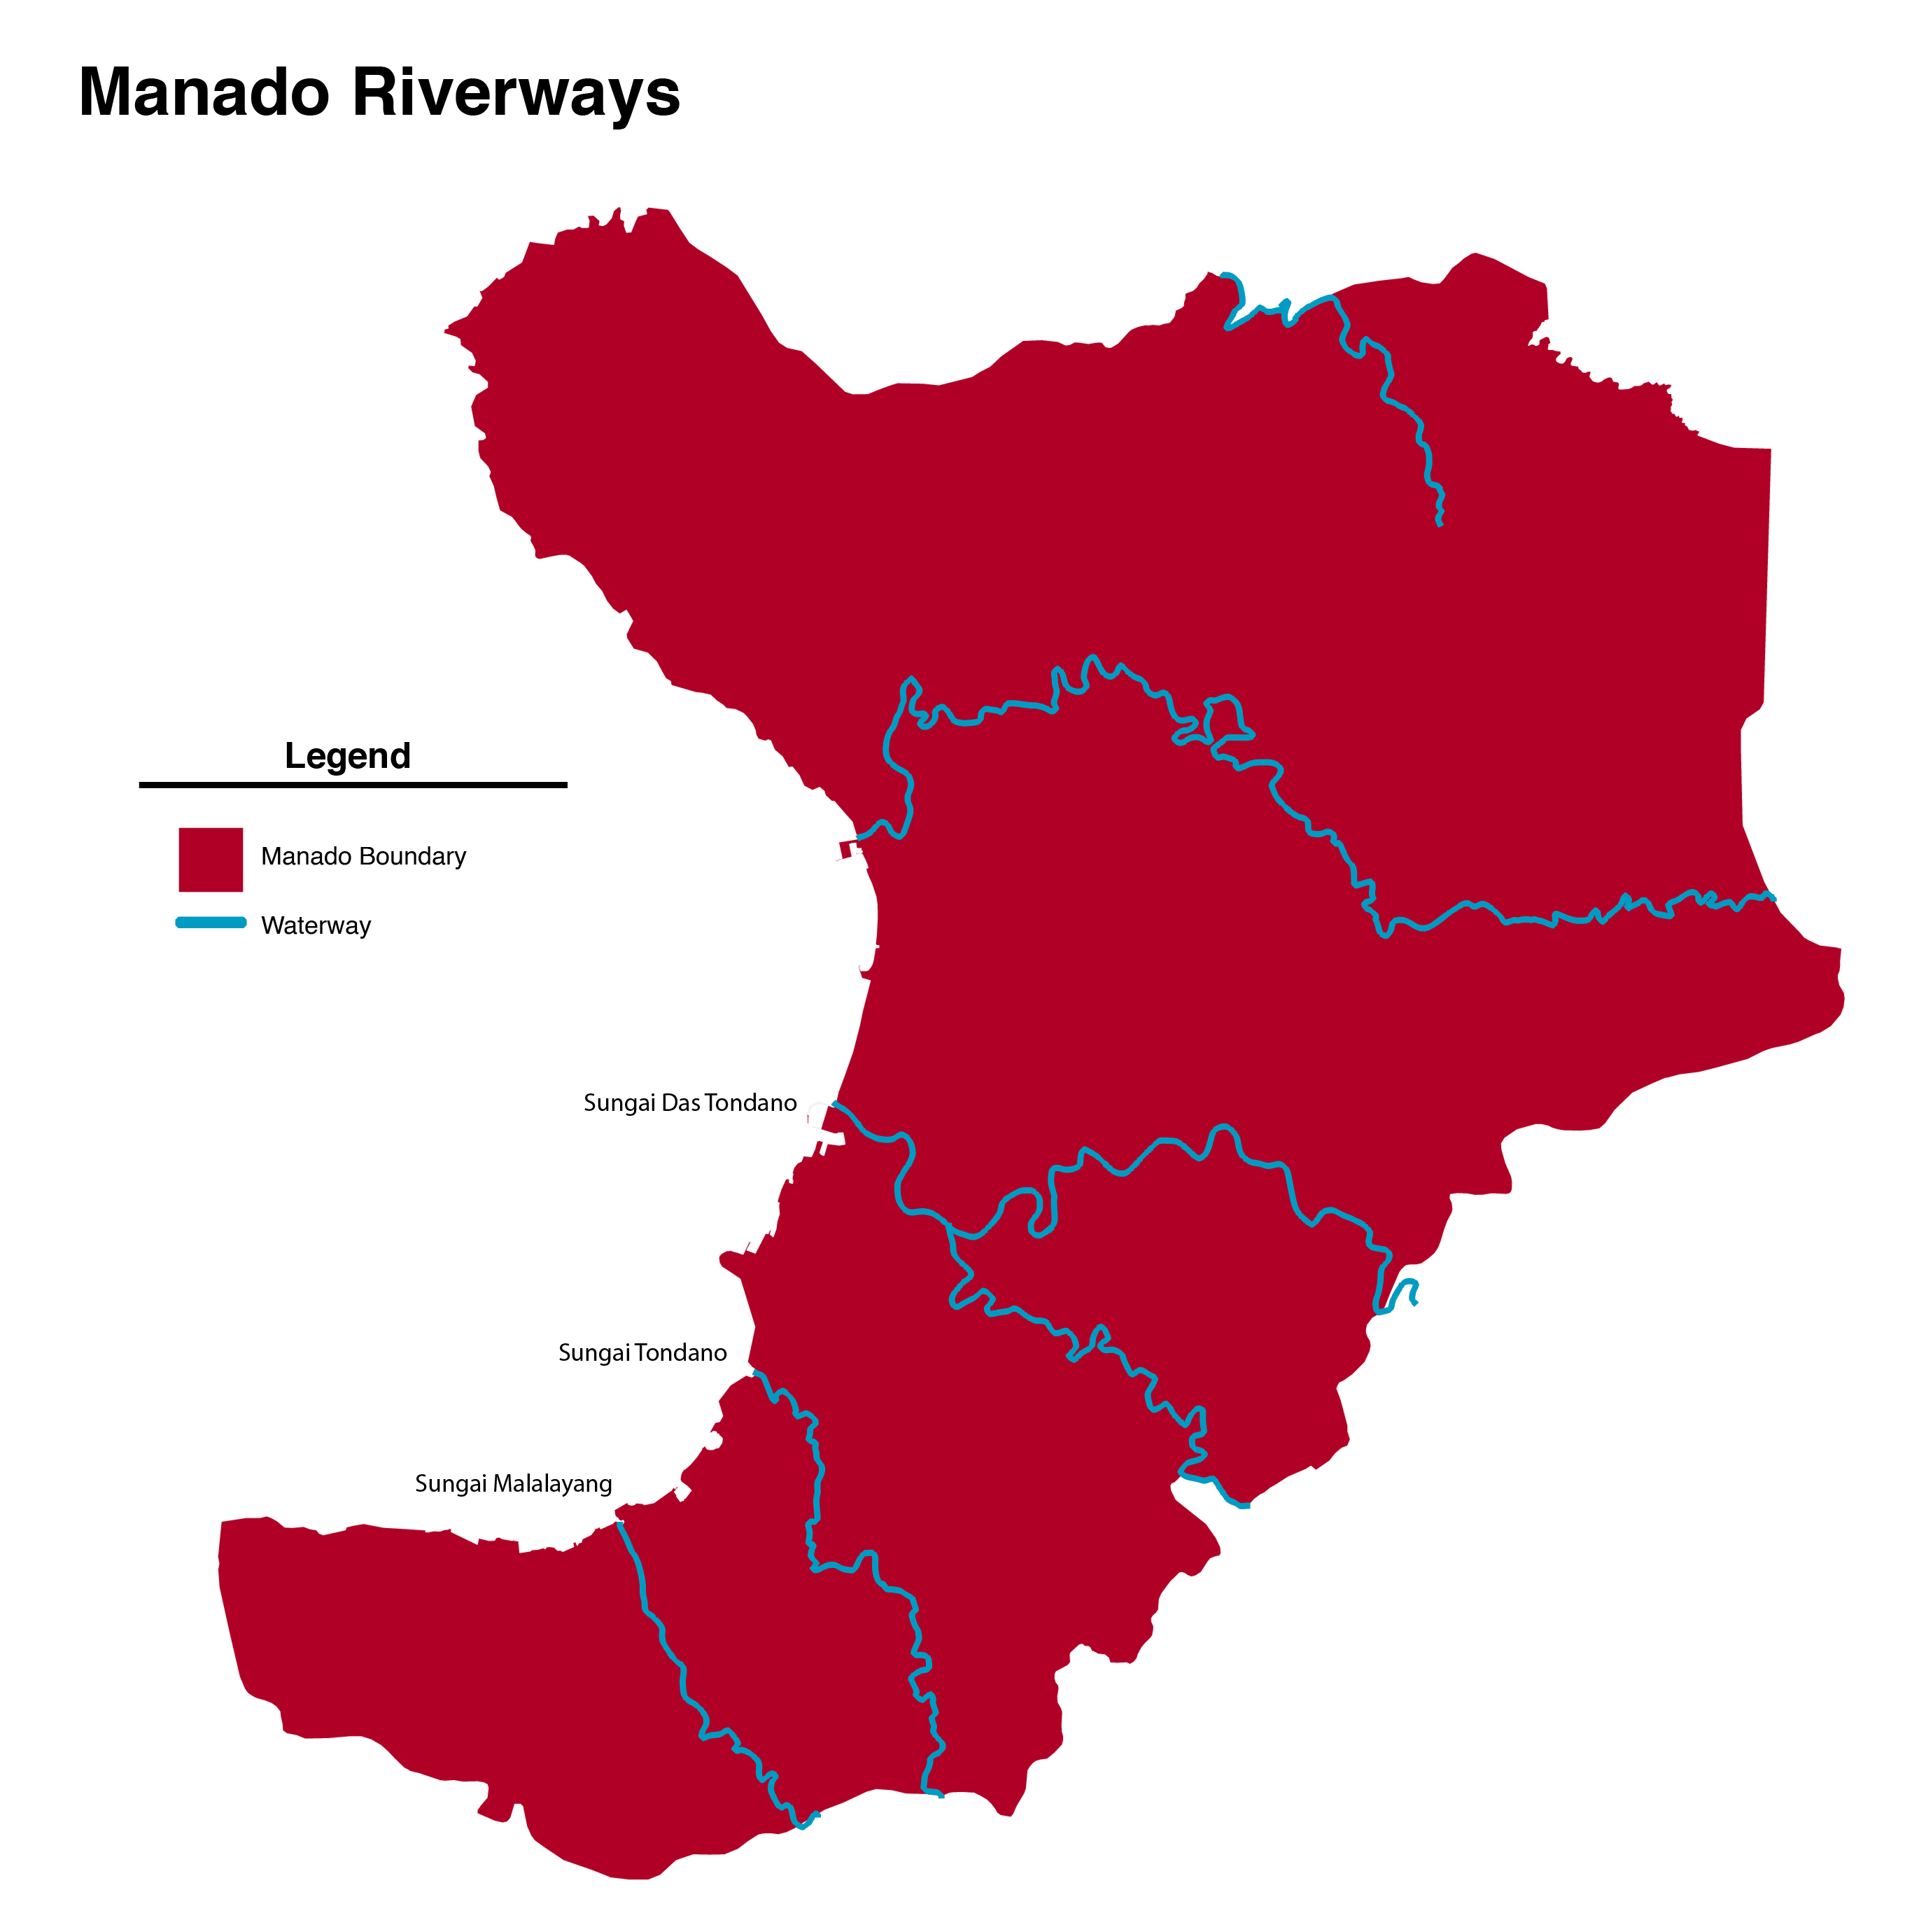
Data work was done in Python — cleaning census records, waste generation logs, and geolocated debris entries. QGIS handled waterway and boundary extraction for the Manado map, pulling features from OpenStreetMap and government datasets. Final layout and typographic treatment were done in Illustrator across multiple iteration rounds (v1 → v2 → v3 → Final).
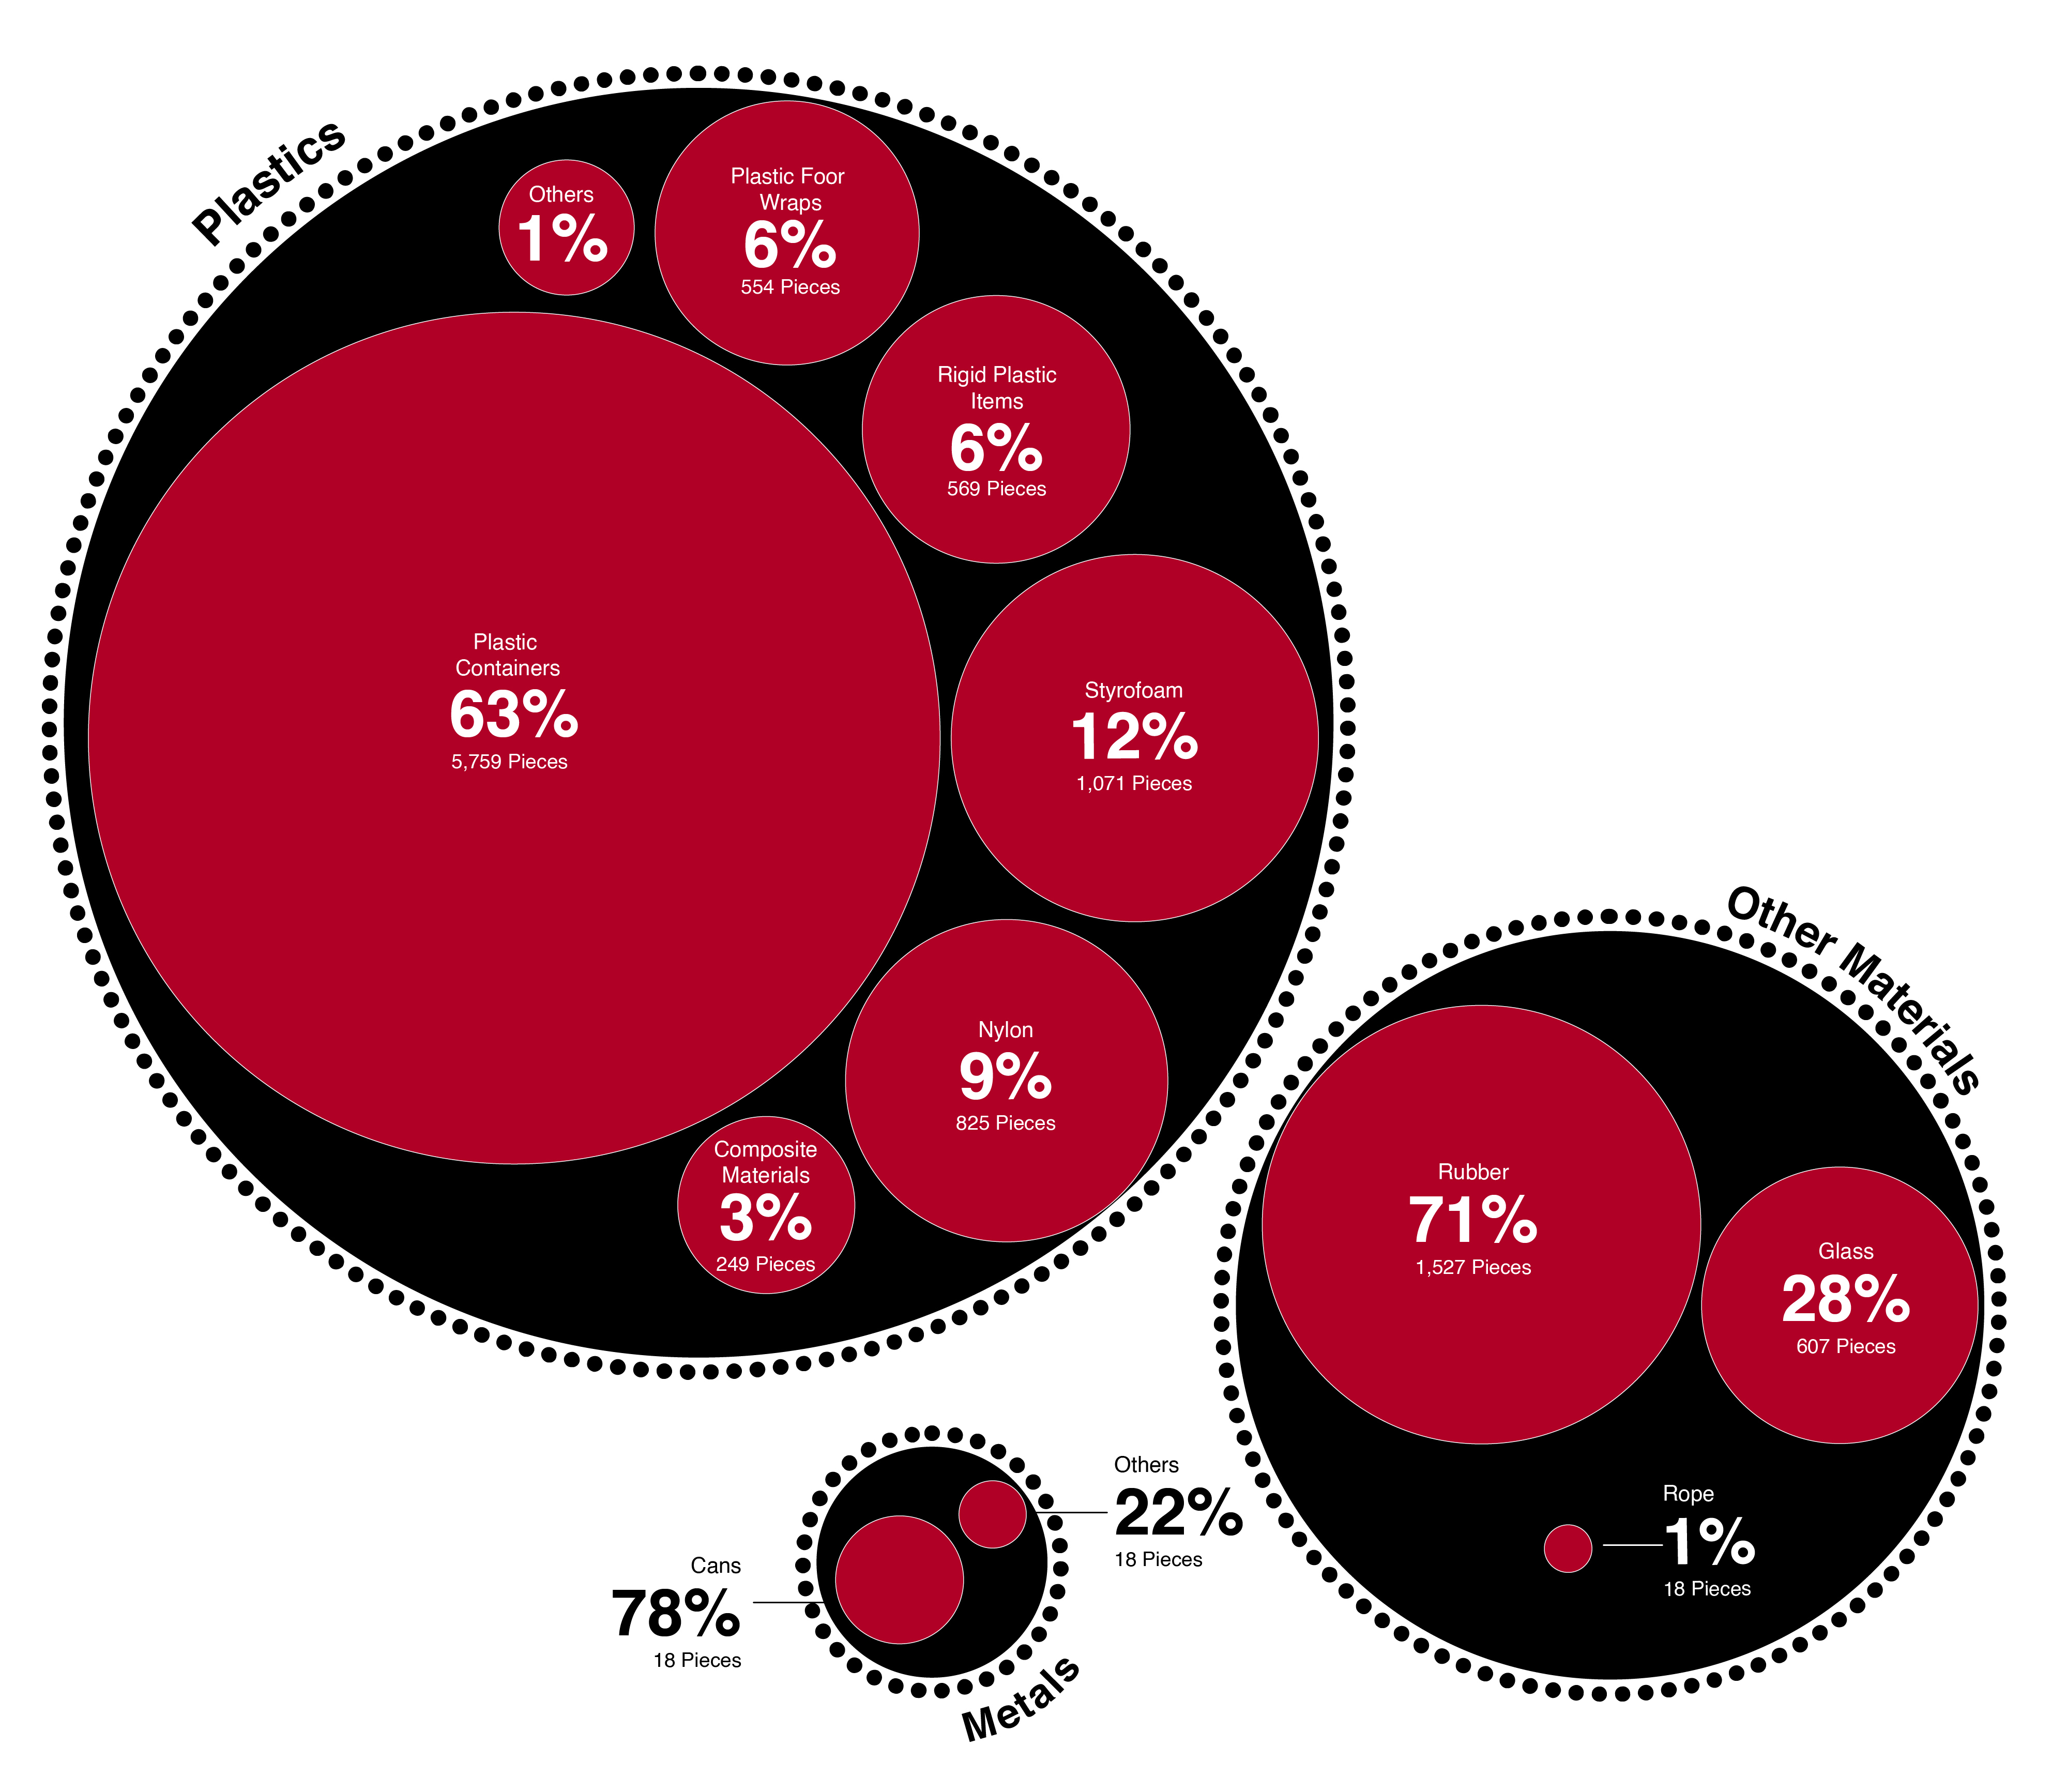
The design system is consistent across all outputs: deep black backgrounds, dark red for emphasis, off-white for data. Bold typography, minimal legend, letting data density carry the visual weight. Multiple rounds of iteration were mostly subtraction — removing axis lines, redundant labels, and chart elements that were technically correct but visually noisy.
Highlights
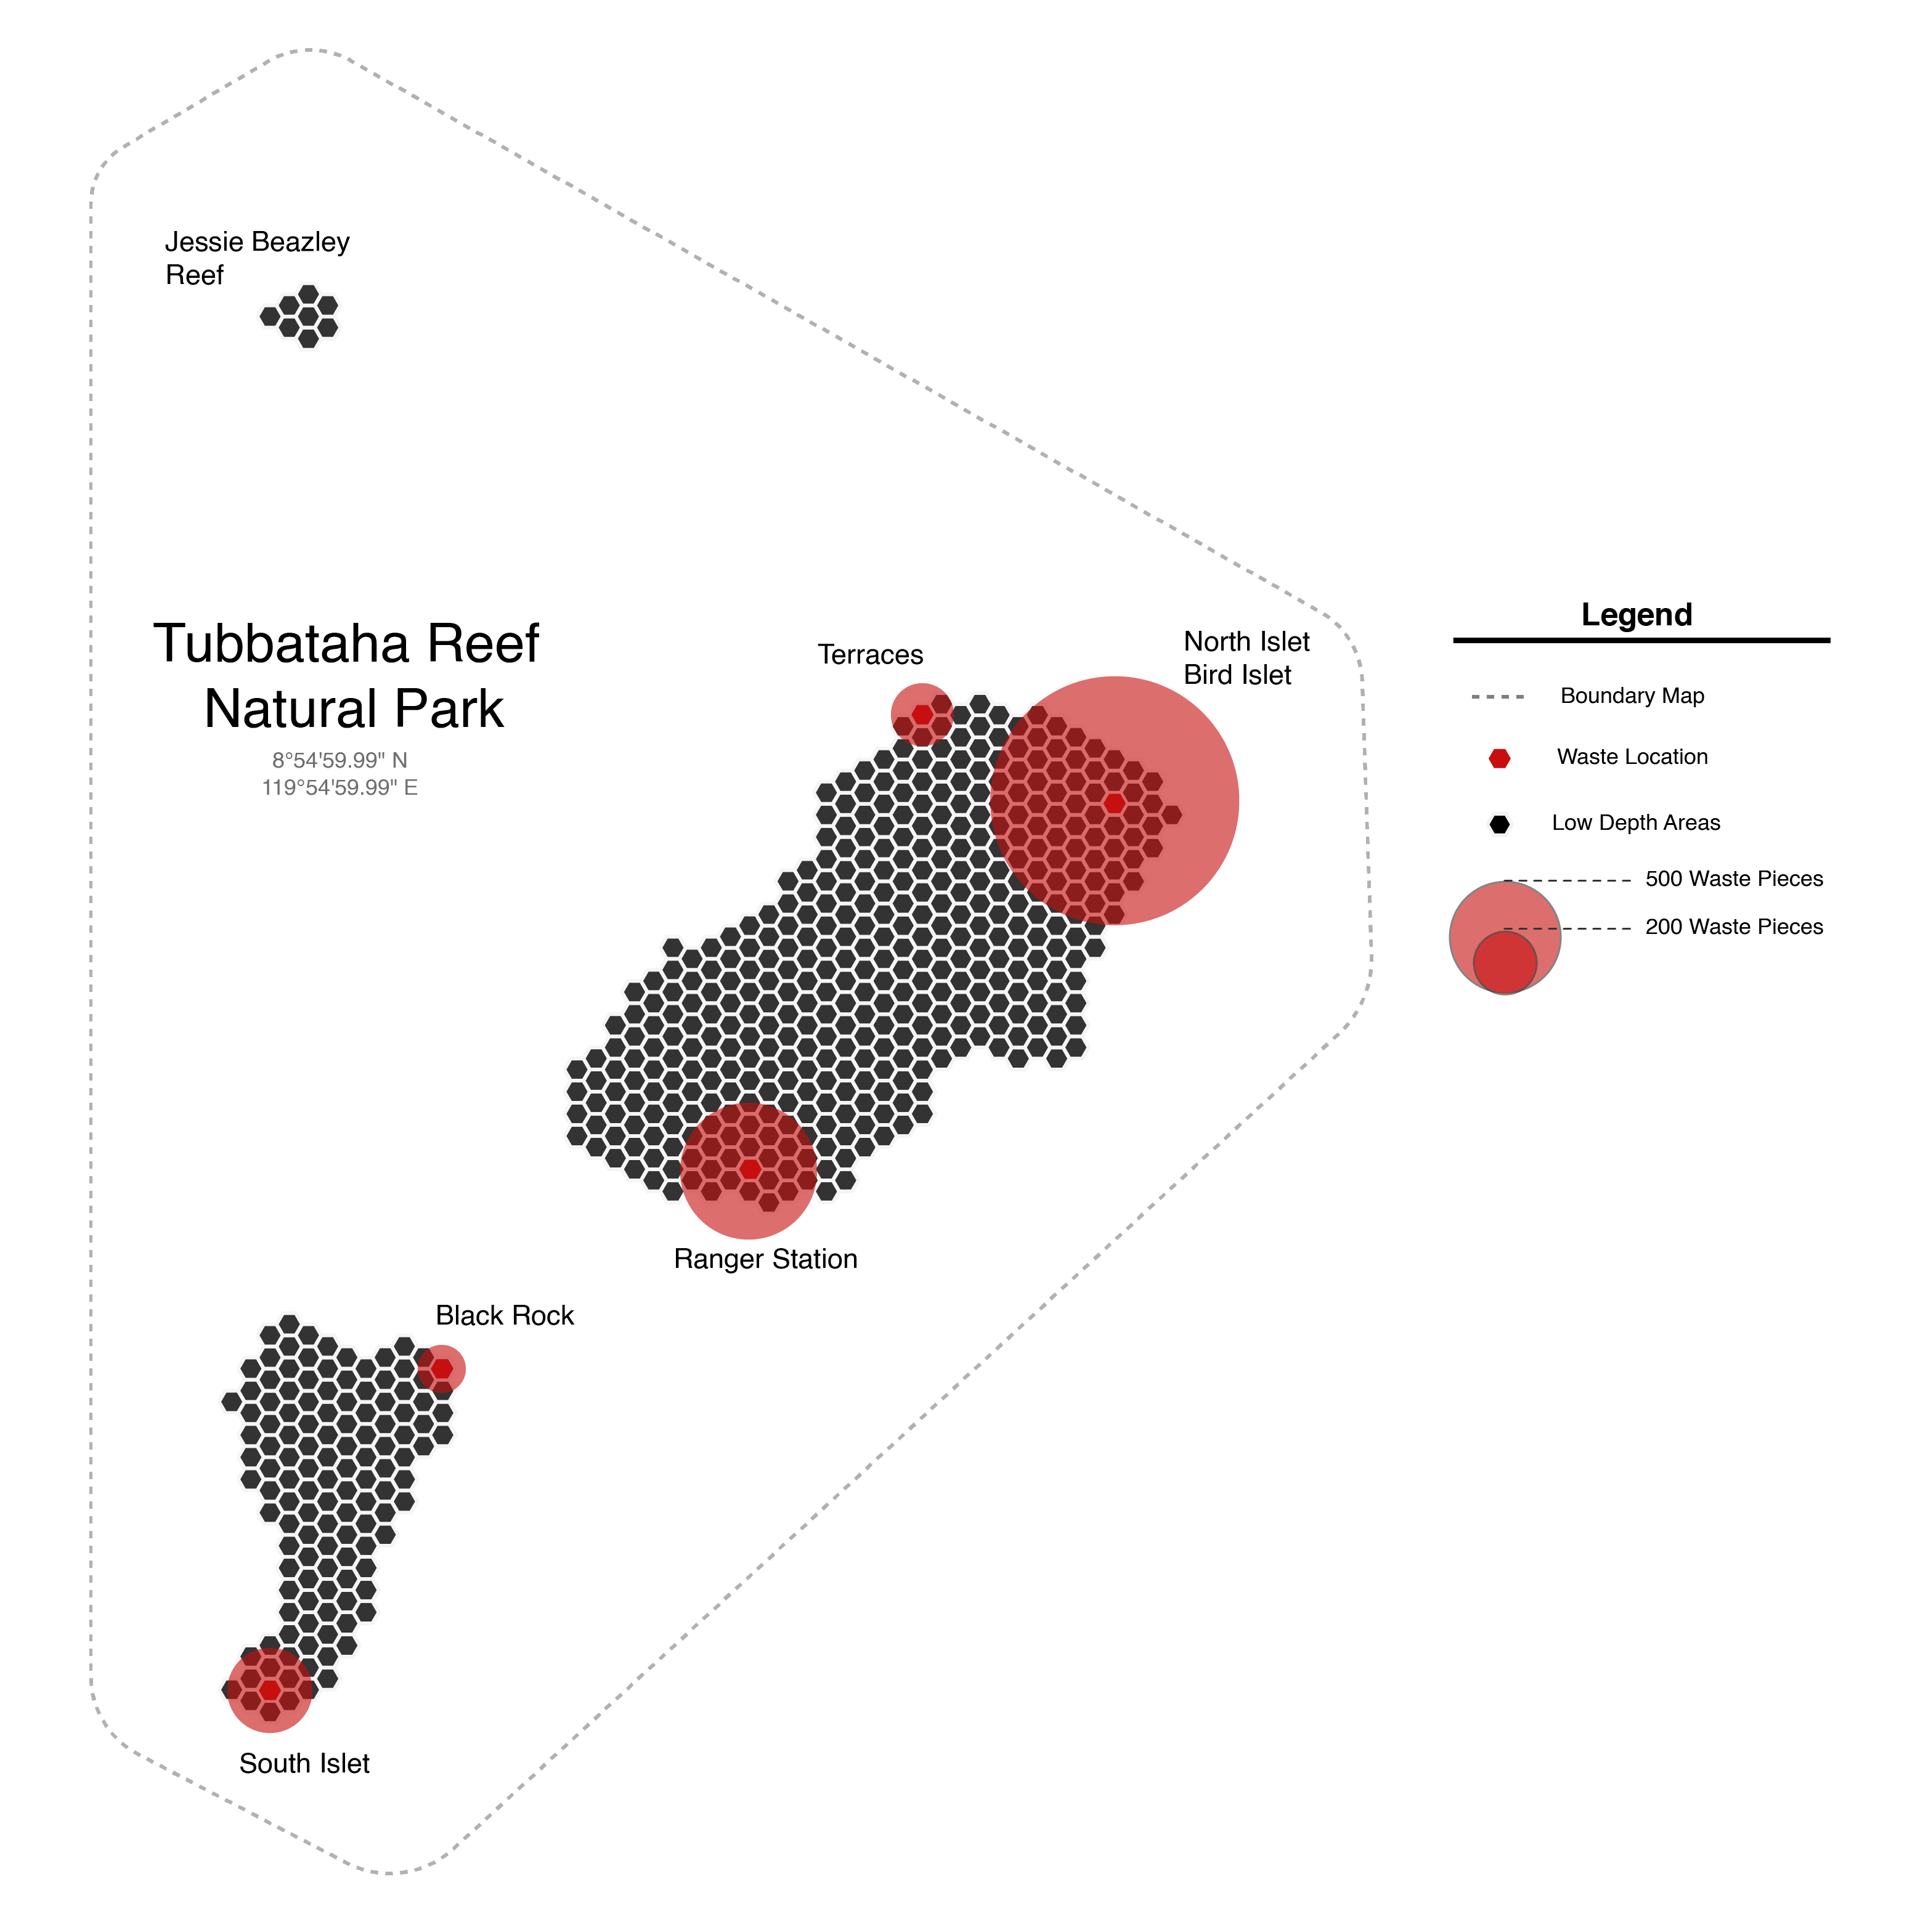
- Hexbin map for Tubbataha surfaces spatial debris patterns without distorting individual collection hauls
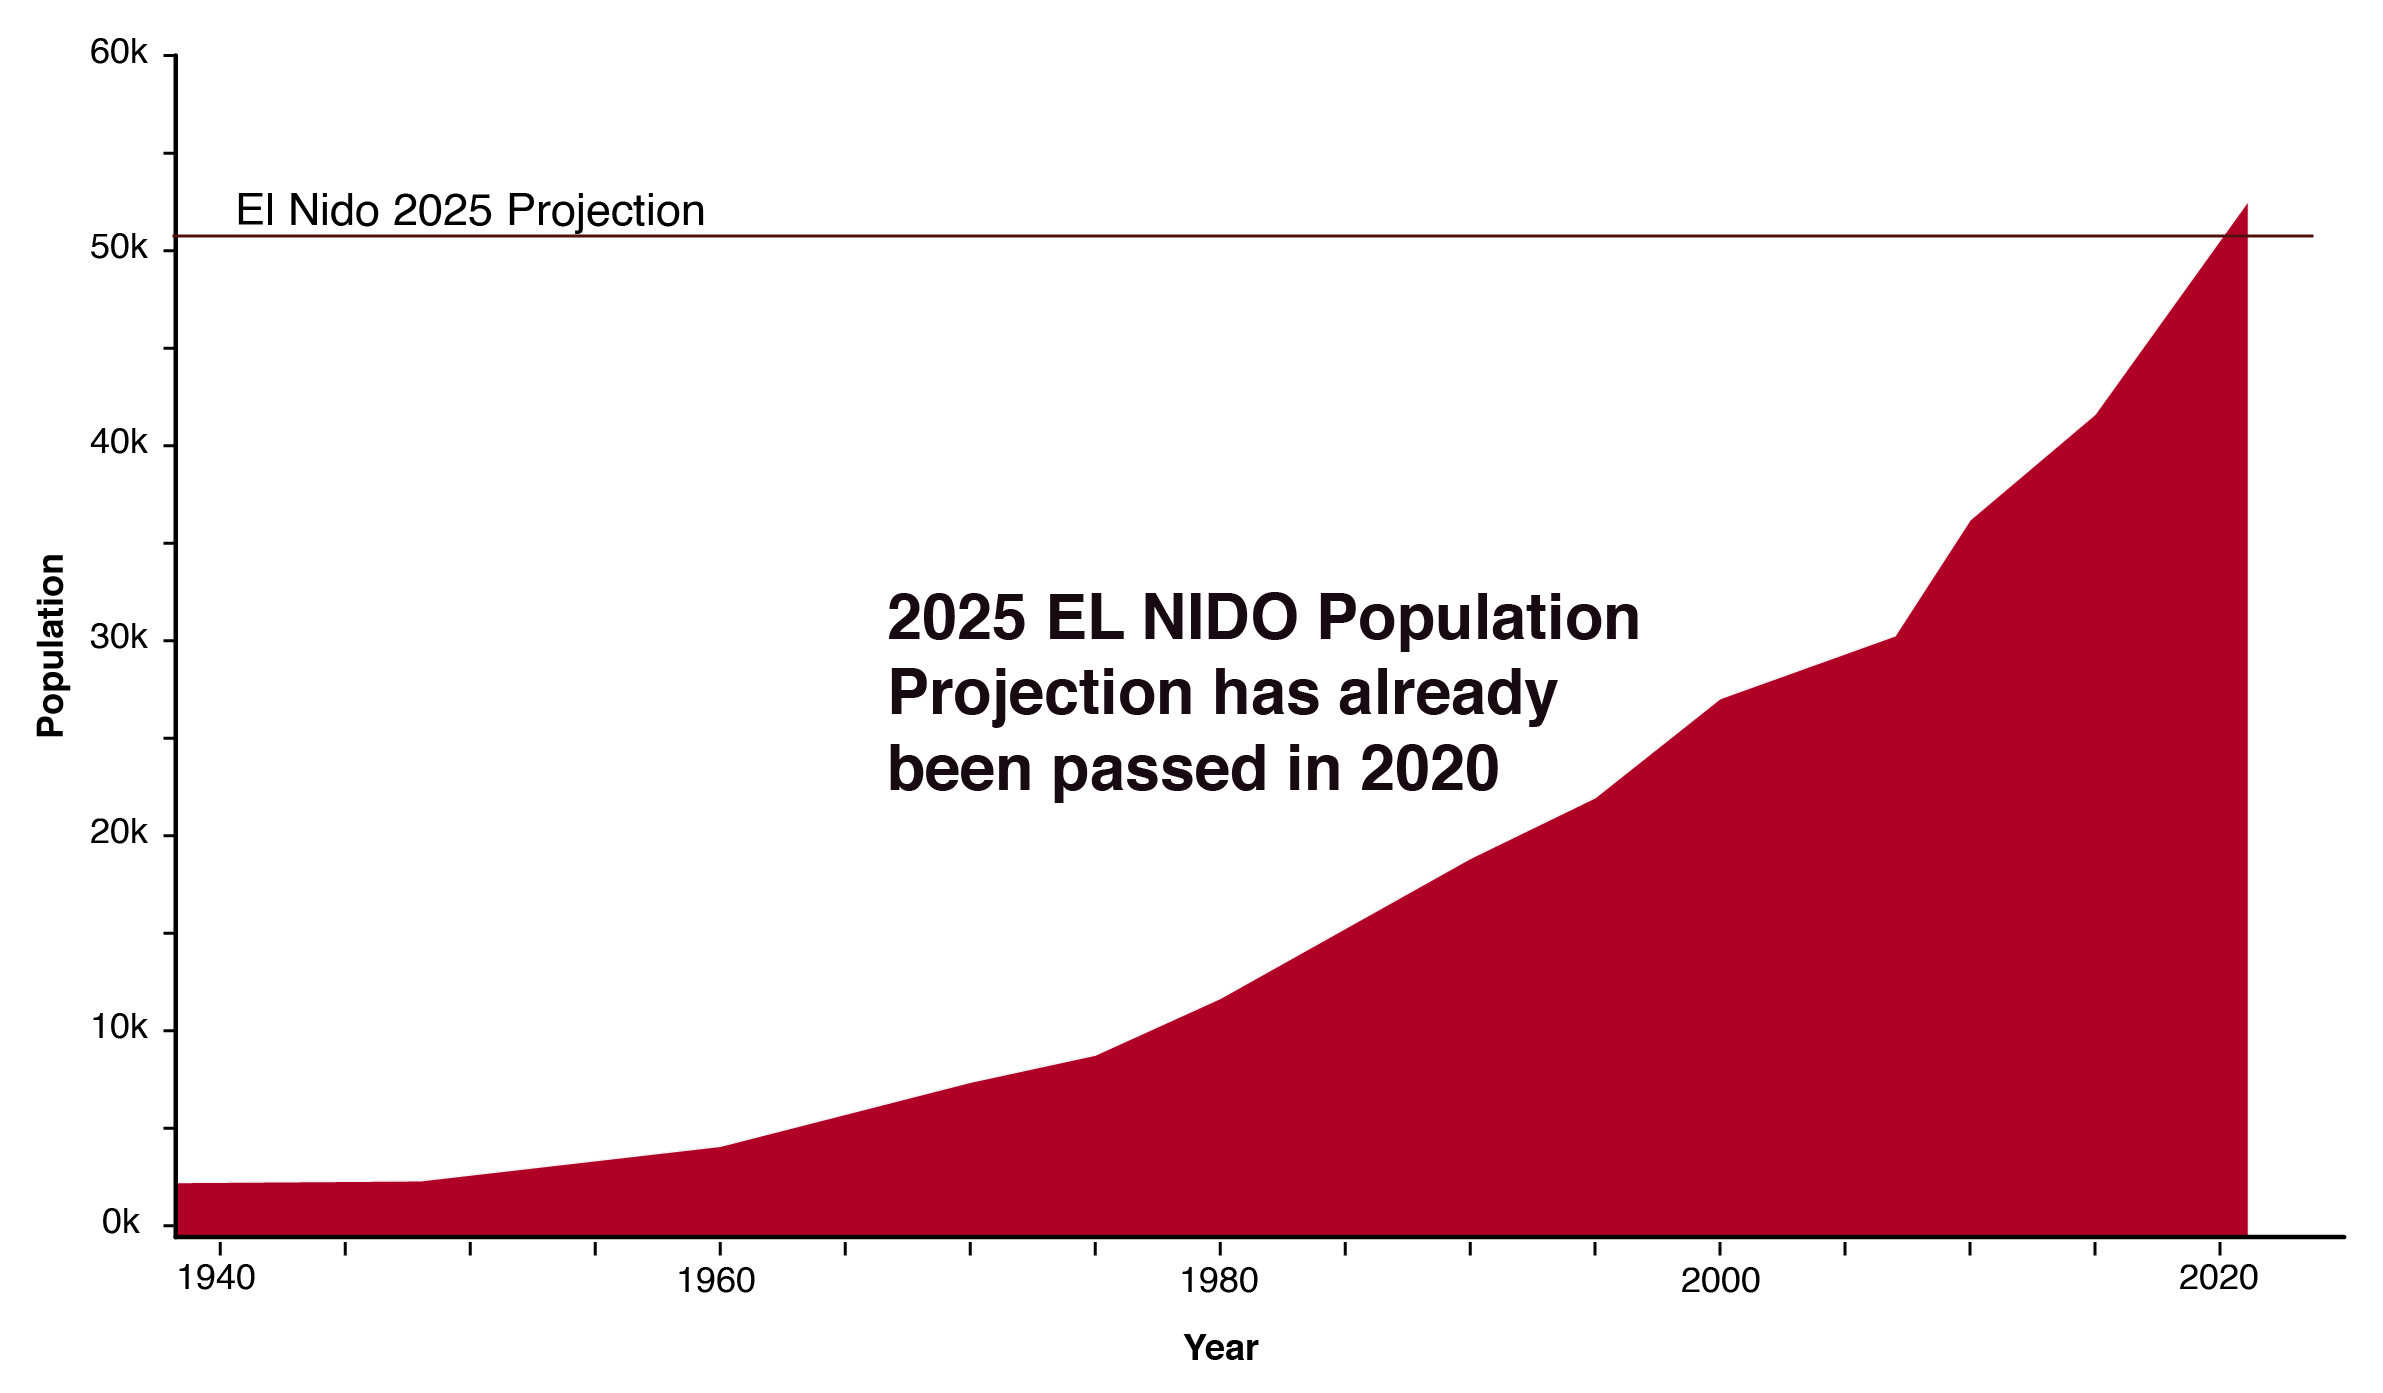
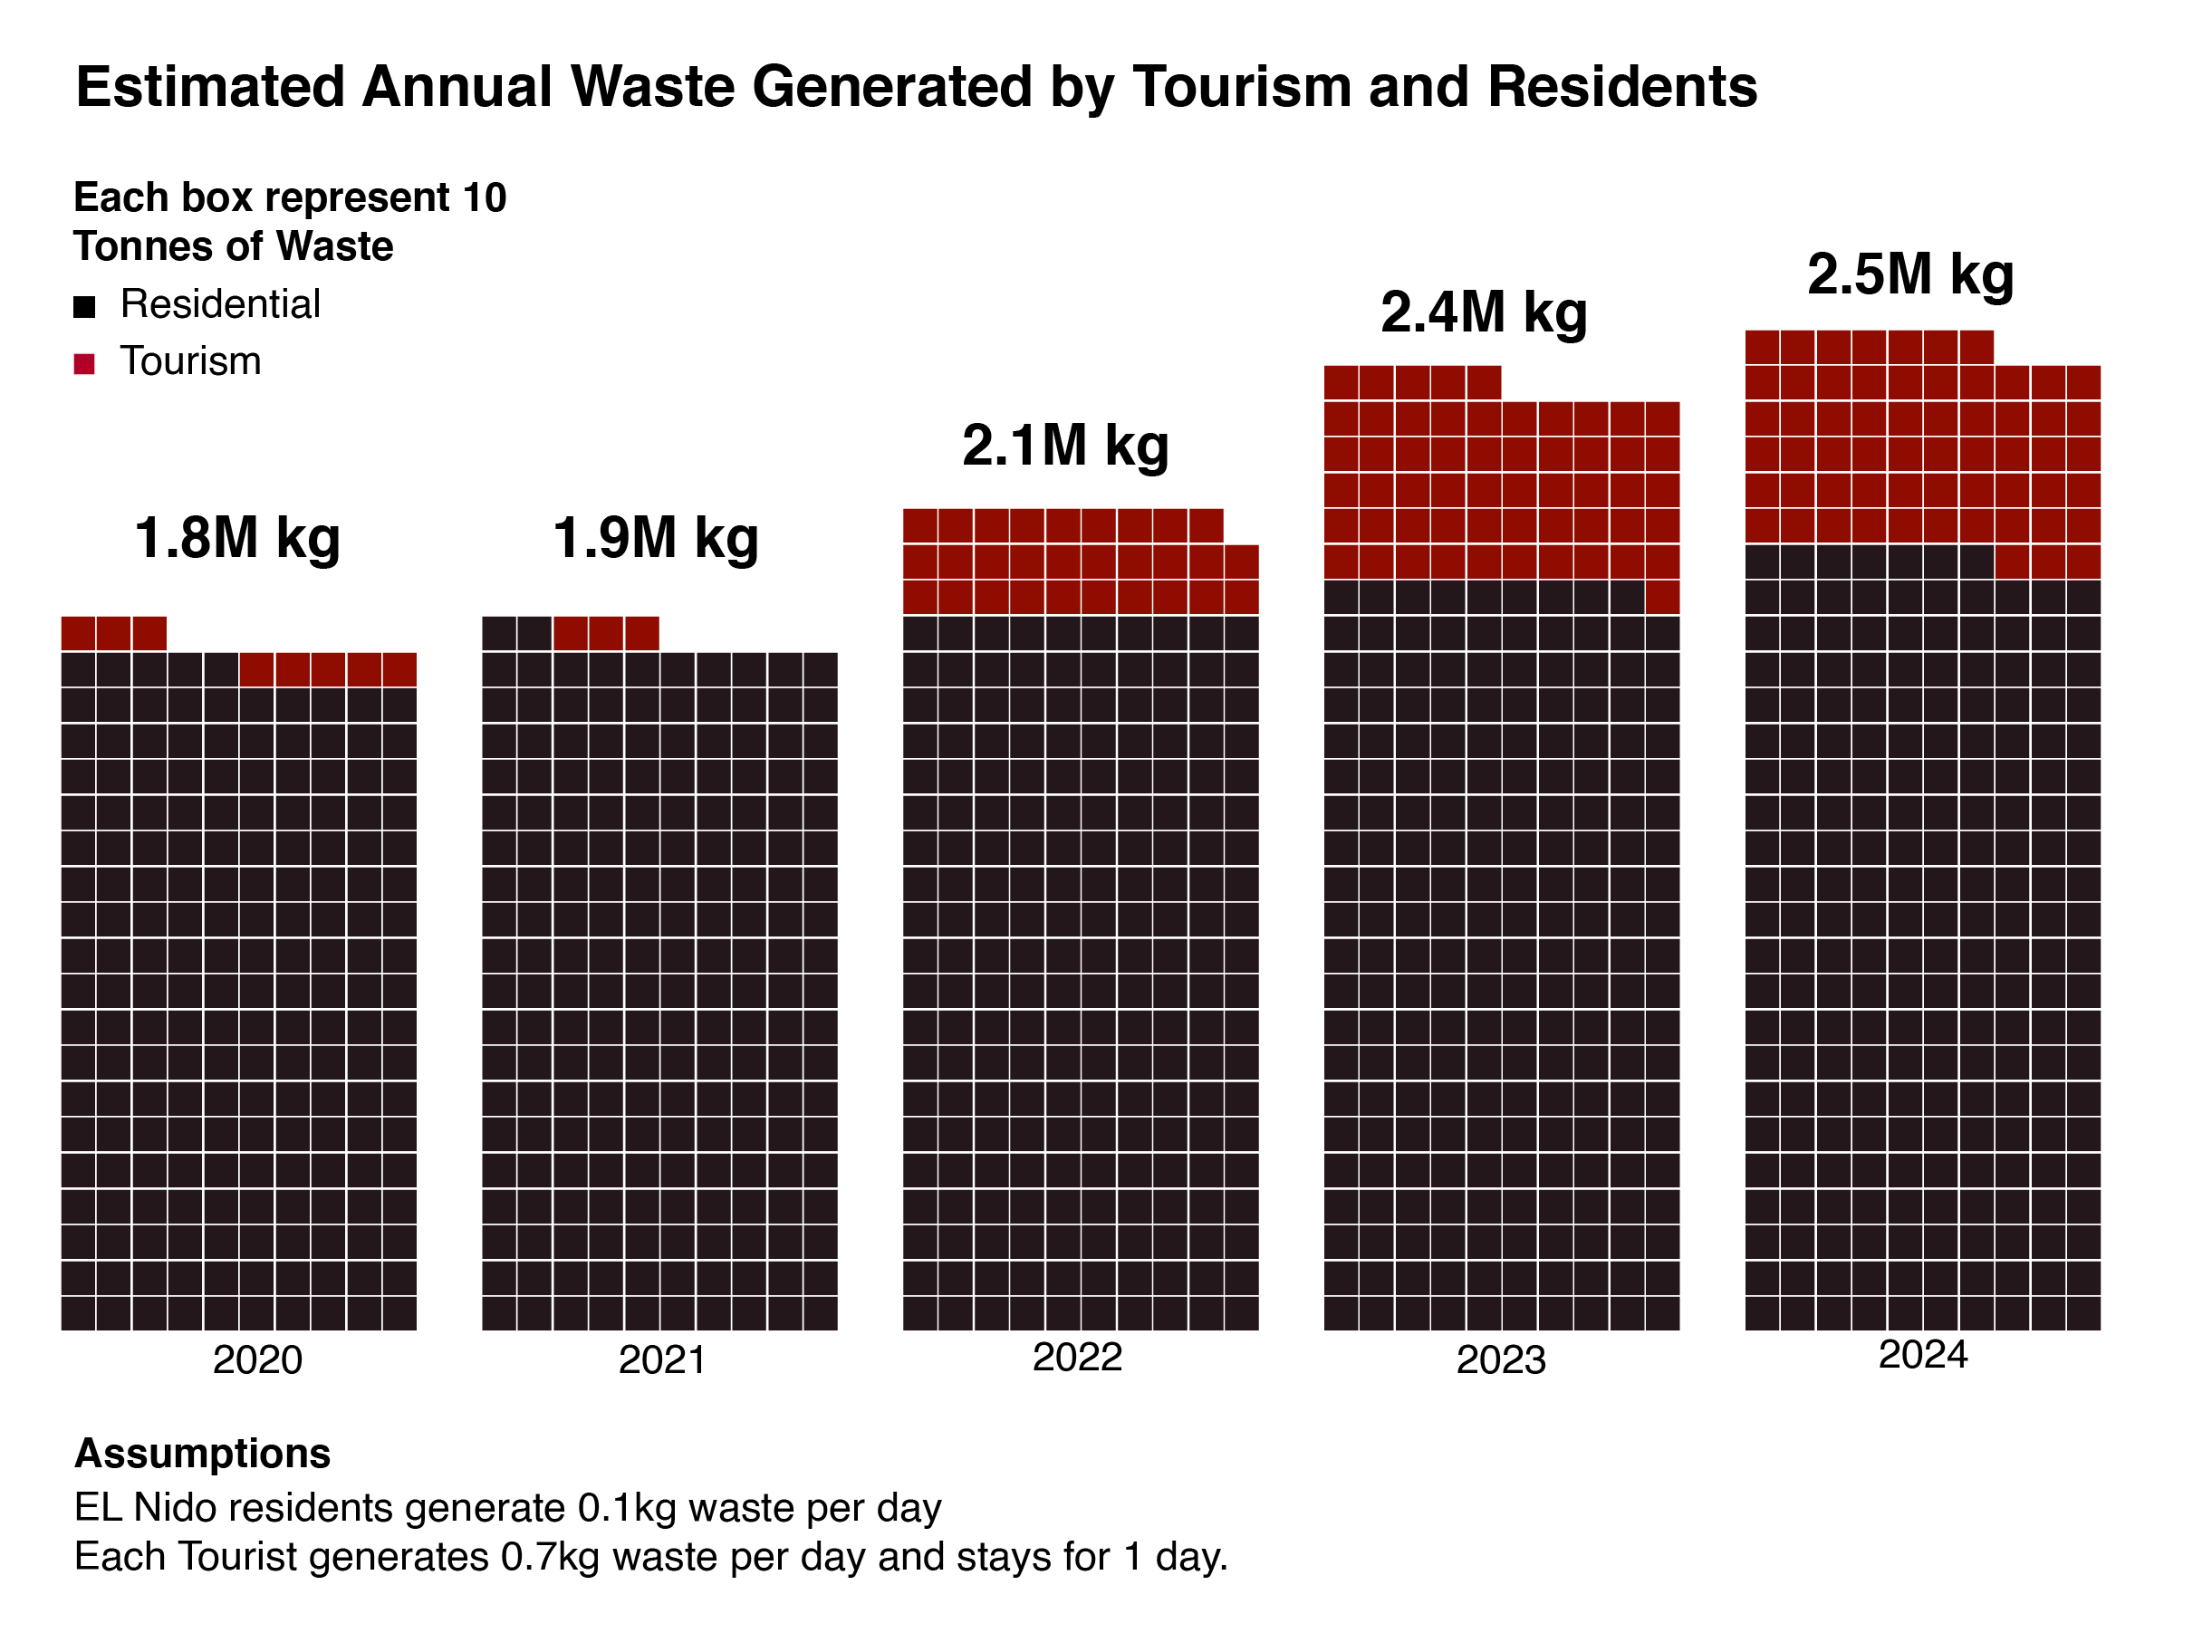
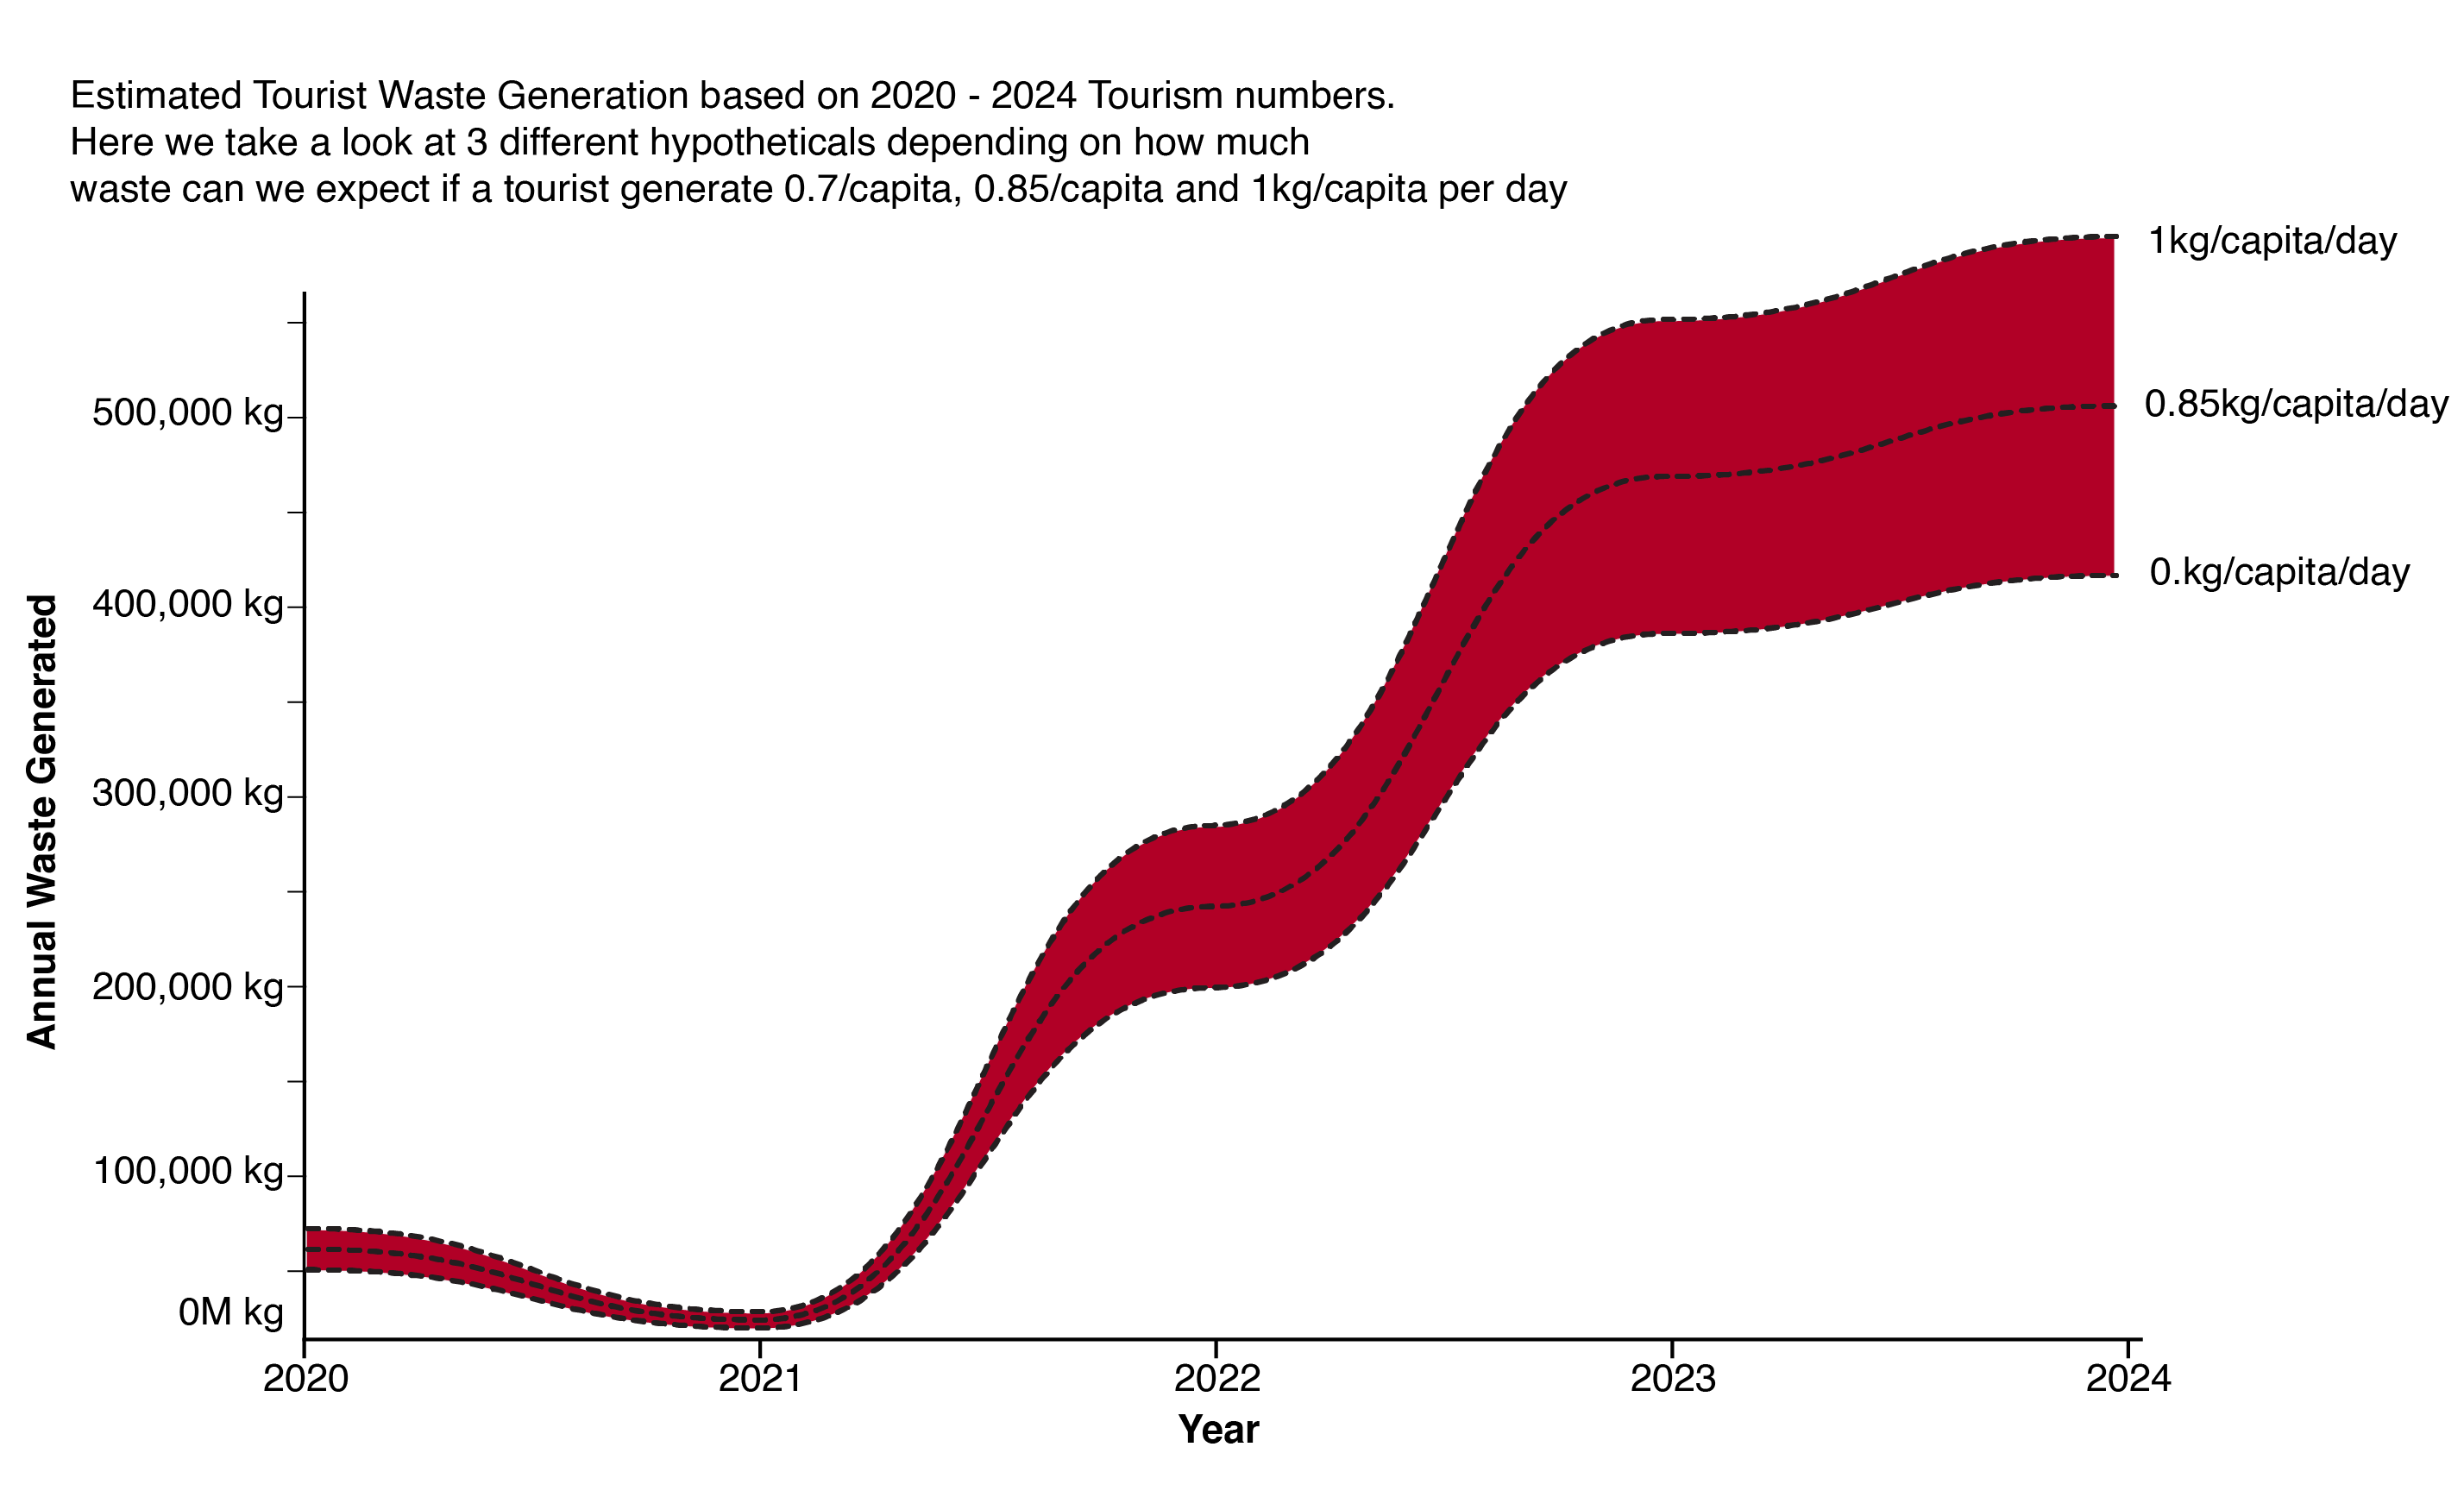
- Area chart and waffle chart pairing for El Nido makes waste tonnage both temporal and countable
- QGIS river extraction for Manado traces the full ridge-to-reef pathway in a single readable map
- Consistent black-and-red design system across three structurally different chart types
- Each chart type chosen for the specific data — no template reuse across locations