Post-pandemic tourism data for the Philippines was dense and hard to read — a wall of regional numbers that obscured the recovery story. The Department of Tourism needed something policymakers and the public could actually parse at a glance.
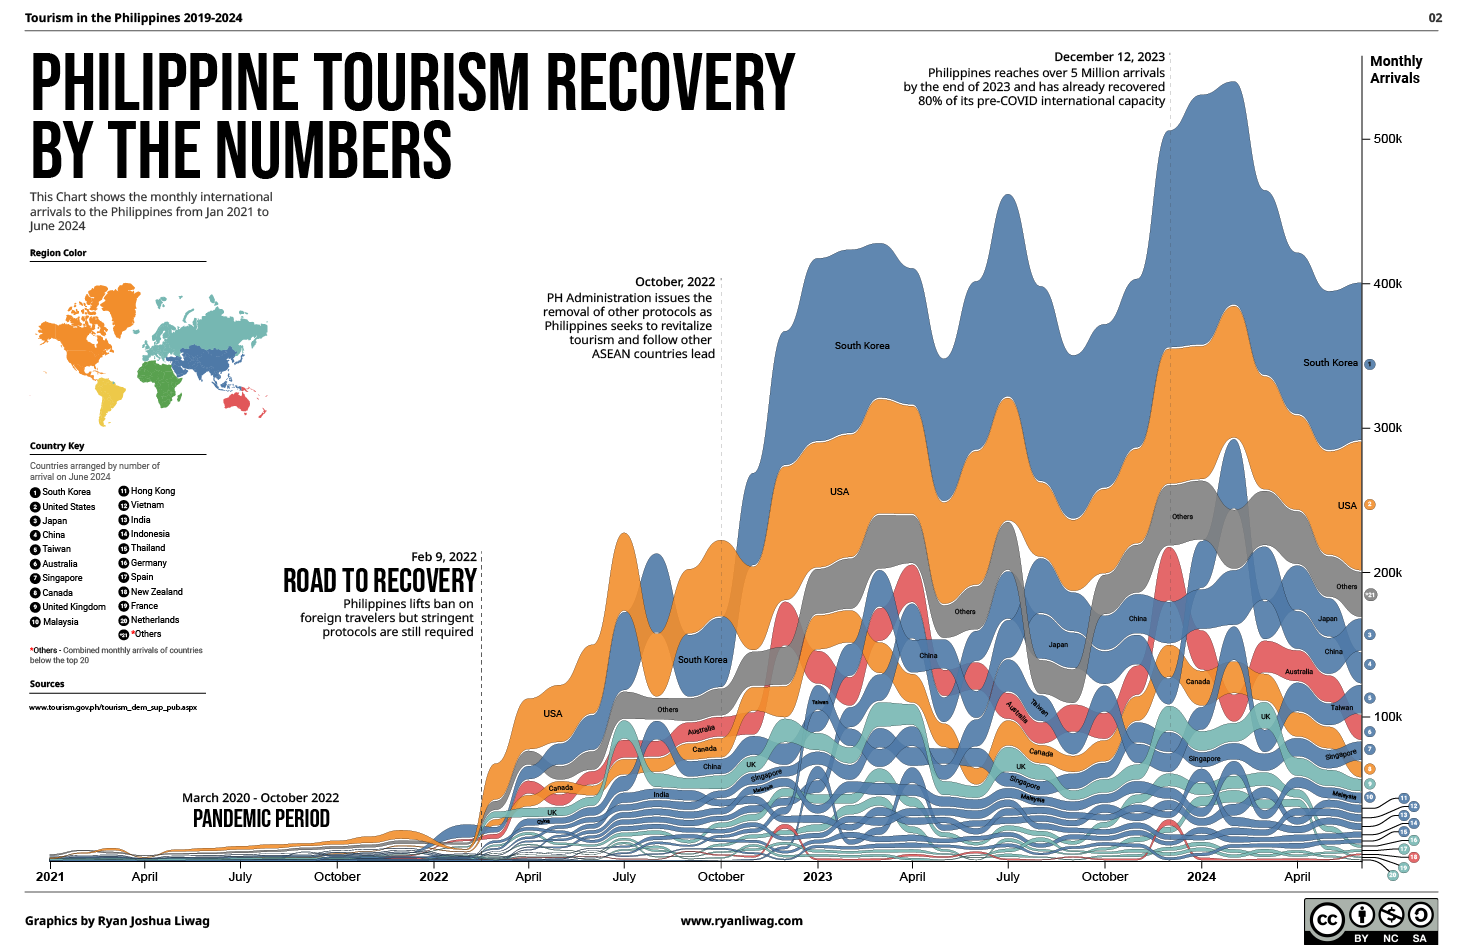
The piece centers on a bump chart tracing each region’s rank from pre-pandemic peaks through the lean years and back again. A color-coded map grounds the rankings geographically, and a seasonal timeline shows where recovery momentum stalled or accelerated.
Process
The data came from DOT regional arrival records. I cleaned and structured it in Observable before moving into Illustrator for typographic treatment and layout. The final interactive version was built in Svelte with D3 handling all chart logic and GSAP managing transitions.
Highlights
- Bump chart surfaces regional rank changes that raw numbers hide
- Seasonal timeline reveals which regions recovered fastest and why
- Color-coded map connects chart positions to actual geography
- Designed for both screen and print export