Studio
Ryan Liwag
I make data stories, charts, and research about the Philippine economy and environment. Everything I publish names its source and shows its method. I also take commissions from newsrooms, NGOs, and research teams who need clear, honest data visualization.
- Data visualization & infographics
- Interactive scrollytelling stories
- Dashboard & report design
- Data analysis & research support
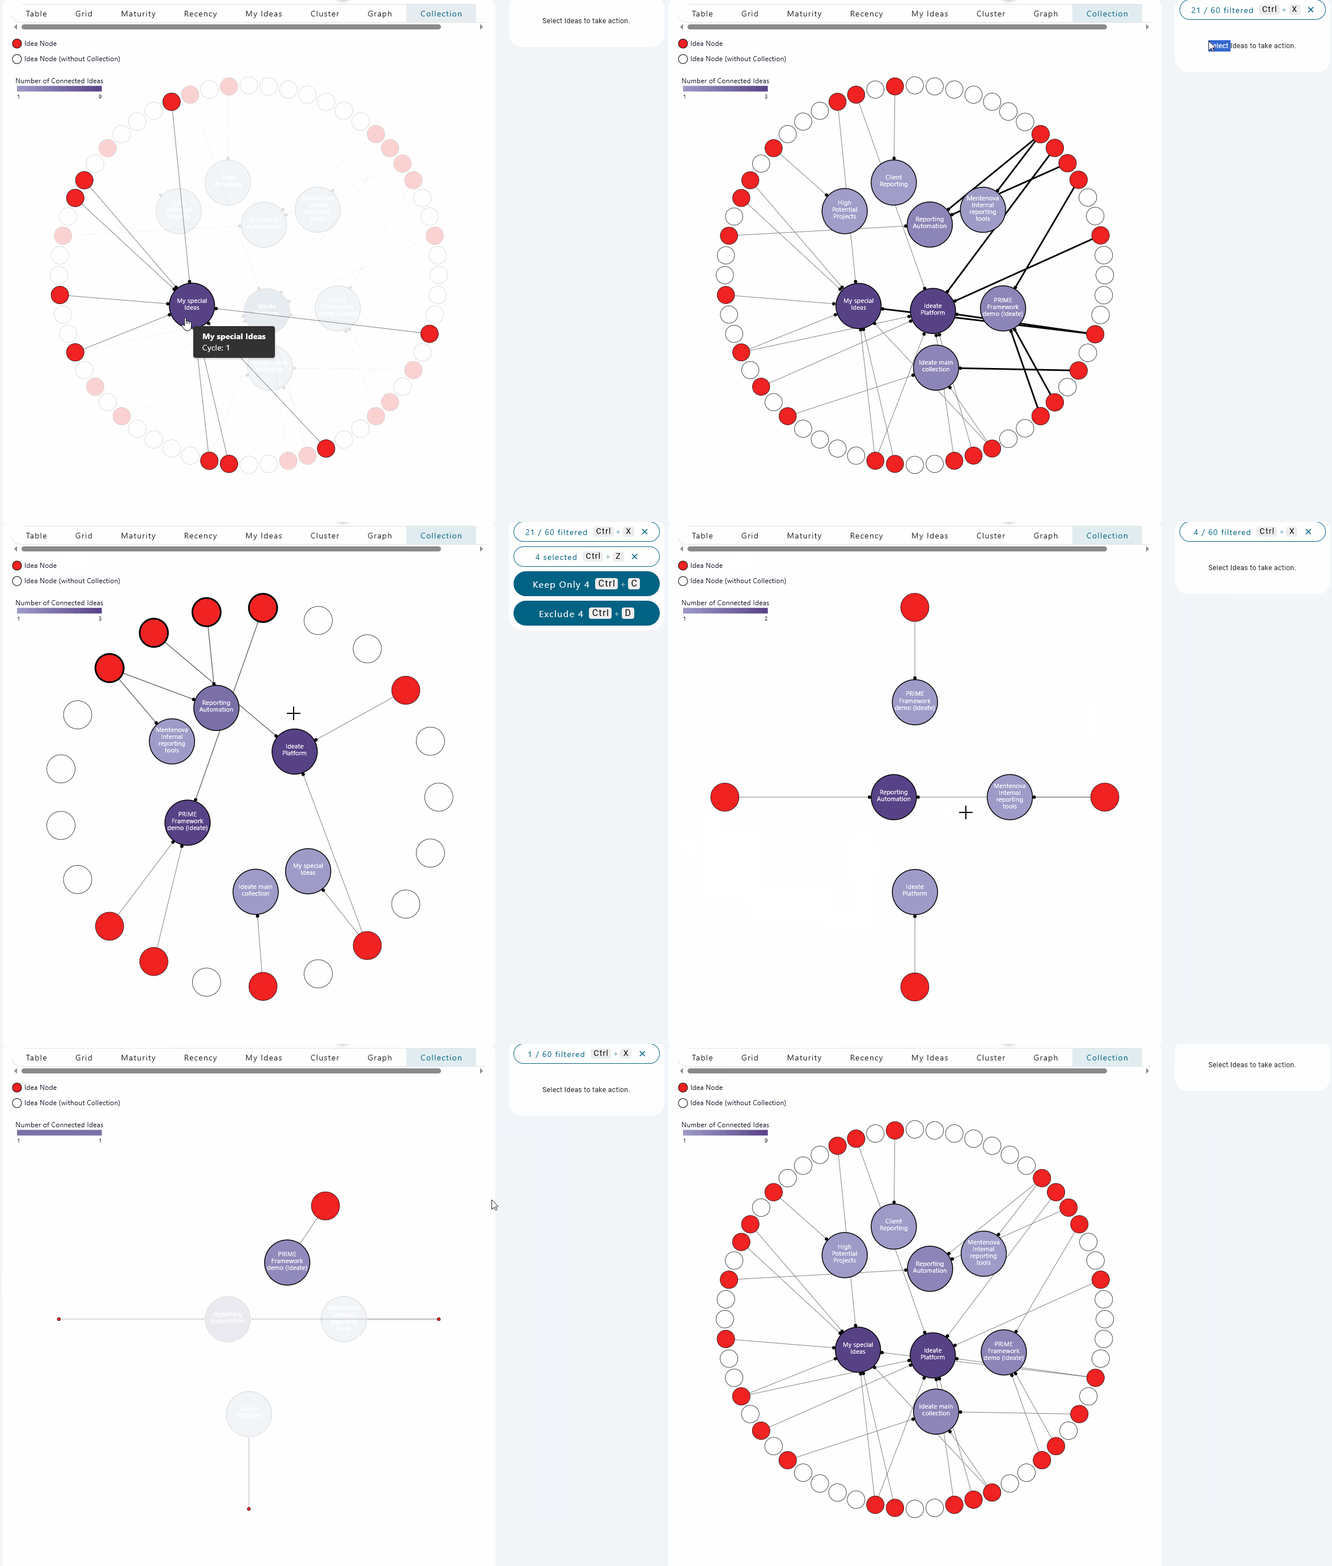
 Idea Landscape Lenses → Interactive D3.js visualization components — Maturity, Recency, and Collection lenses — for exploring an idea management platform's data landscape.
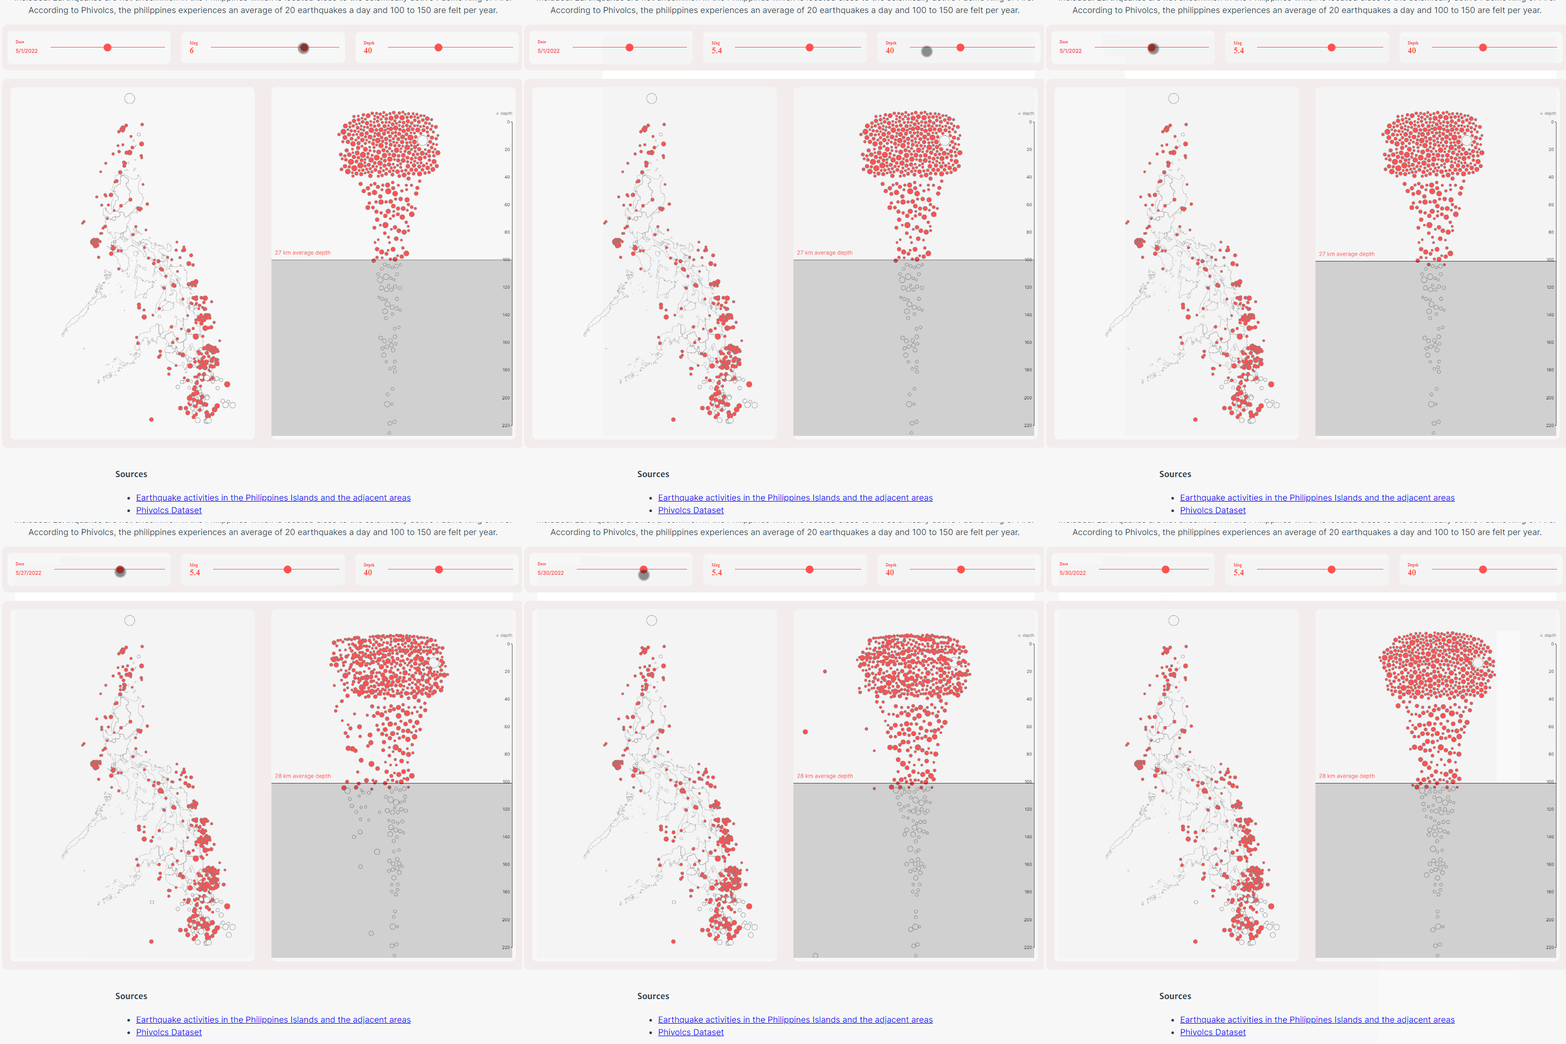
  Ring of Fire → An interactive canvas-based scrollytelling story mapping 18,139 Philippine earthquakes from 2024 — from raw scatter to Mercator map, with animated transitions between five data views.
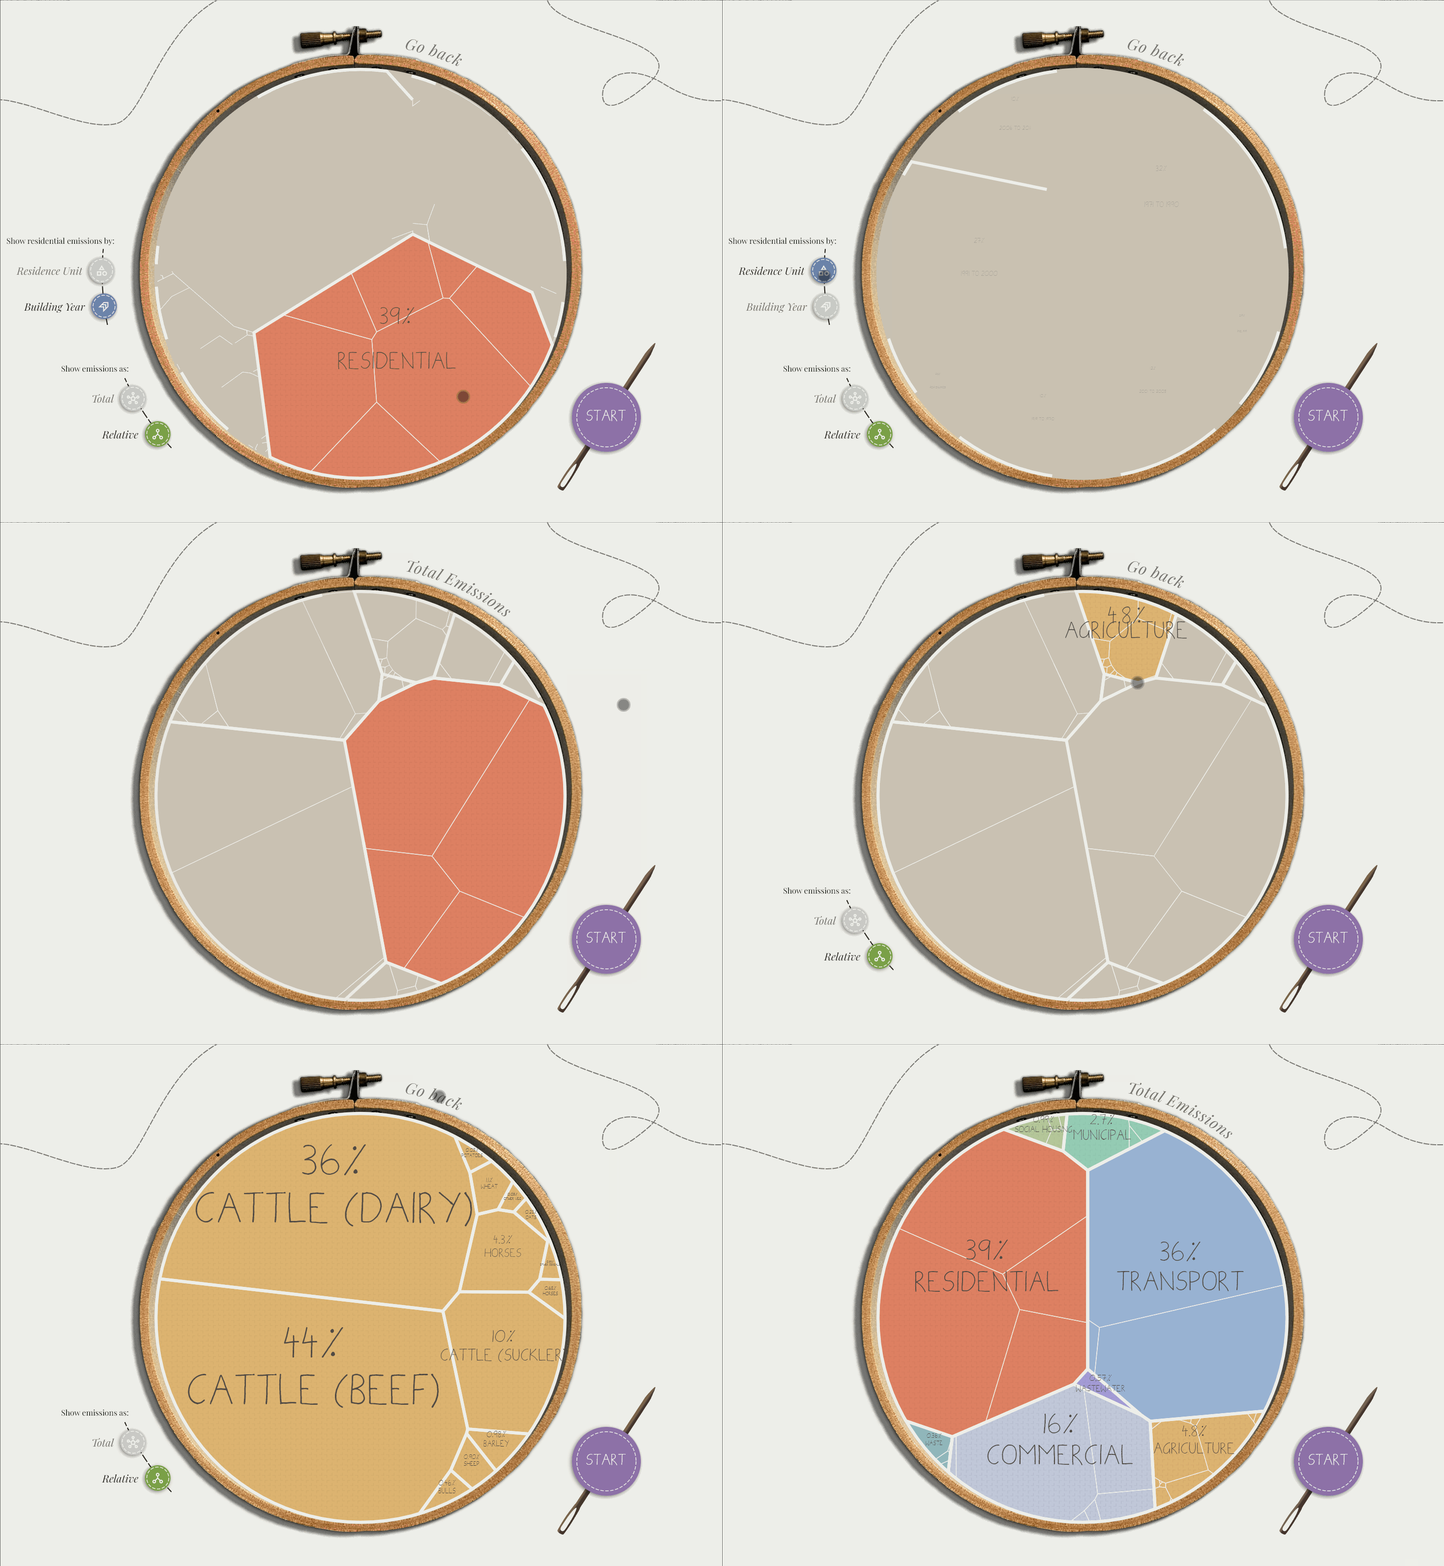
  Maynooth Emission Voronoi → An interactive Voronoi diagram tracking real-time emissions around Maynooth, Ireland — built during an internship at Data & Design.
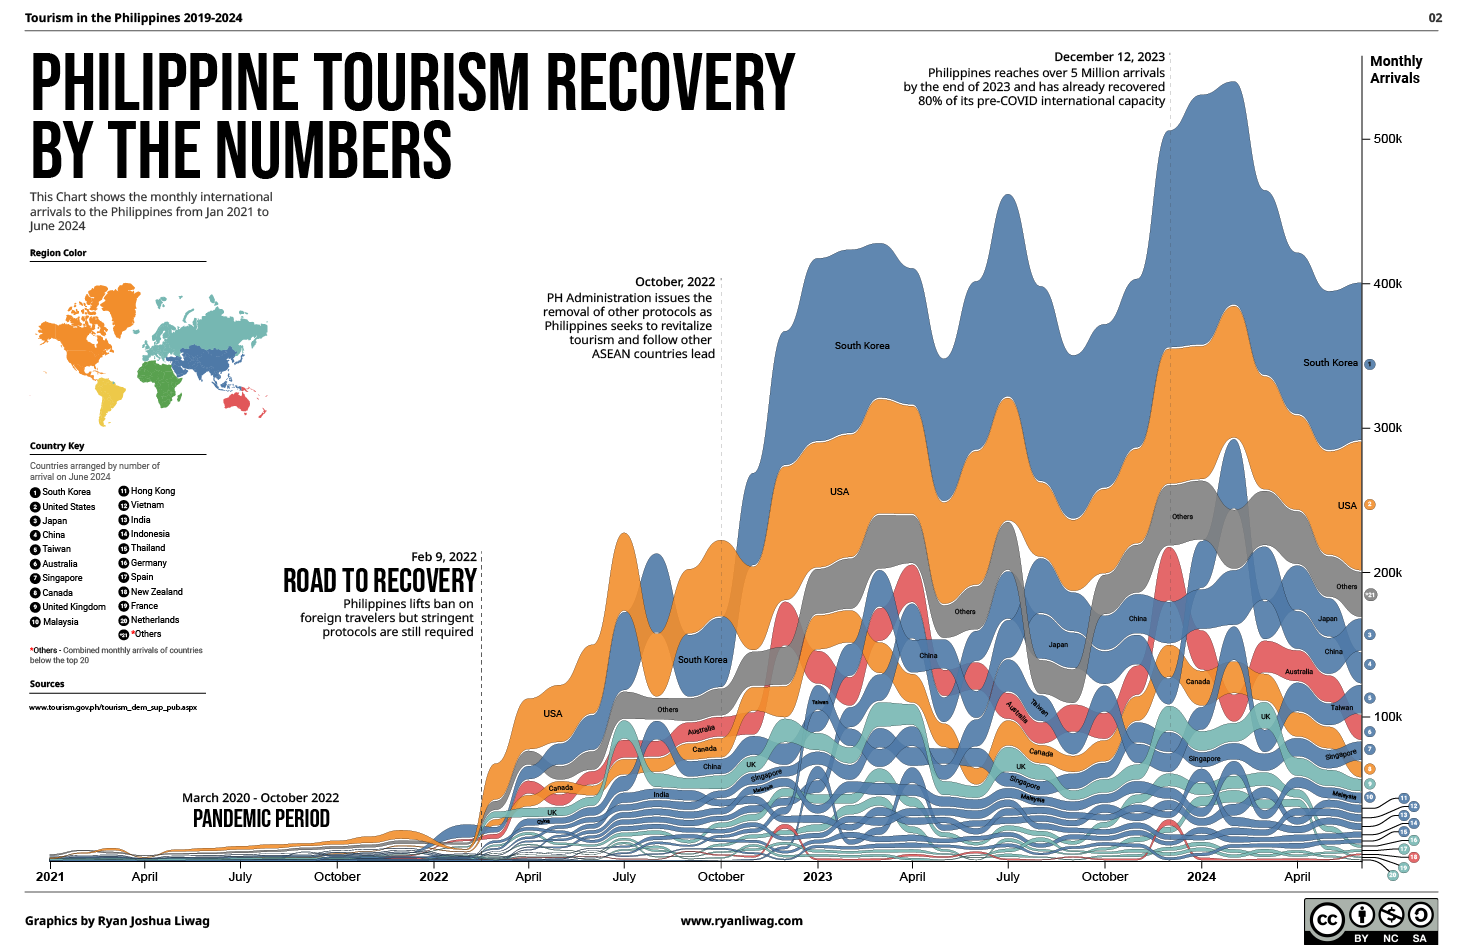
  PH Tourism Recovery → An infographic charting the Philippines' regional tourism recovery after the pandemic, built for the Department of Tourism.
  Plastic Oceans → A static infographic version of the Plastic Oceans story — using non-traditional visualization to show why the Philippines is responsible for a third of all ocean plastic.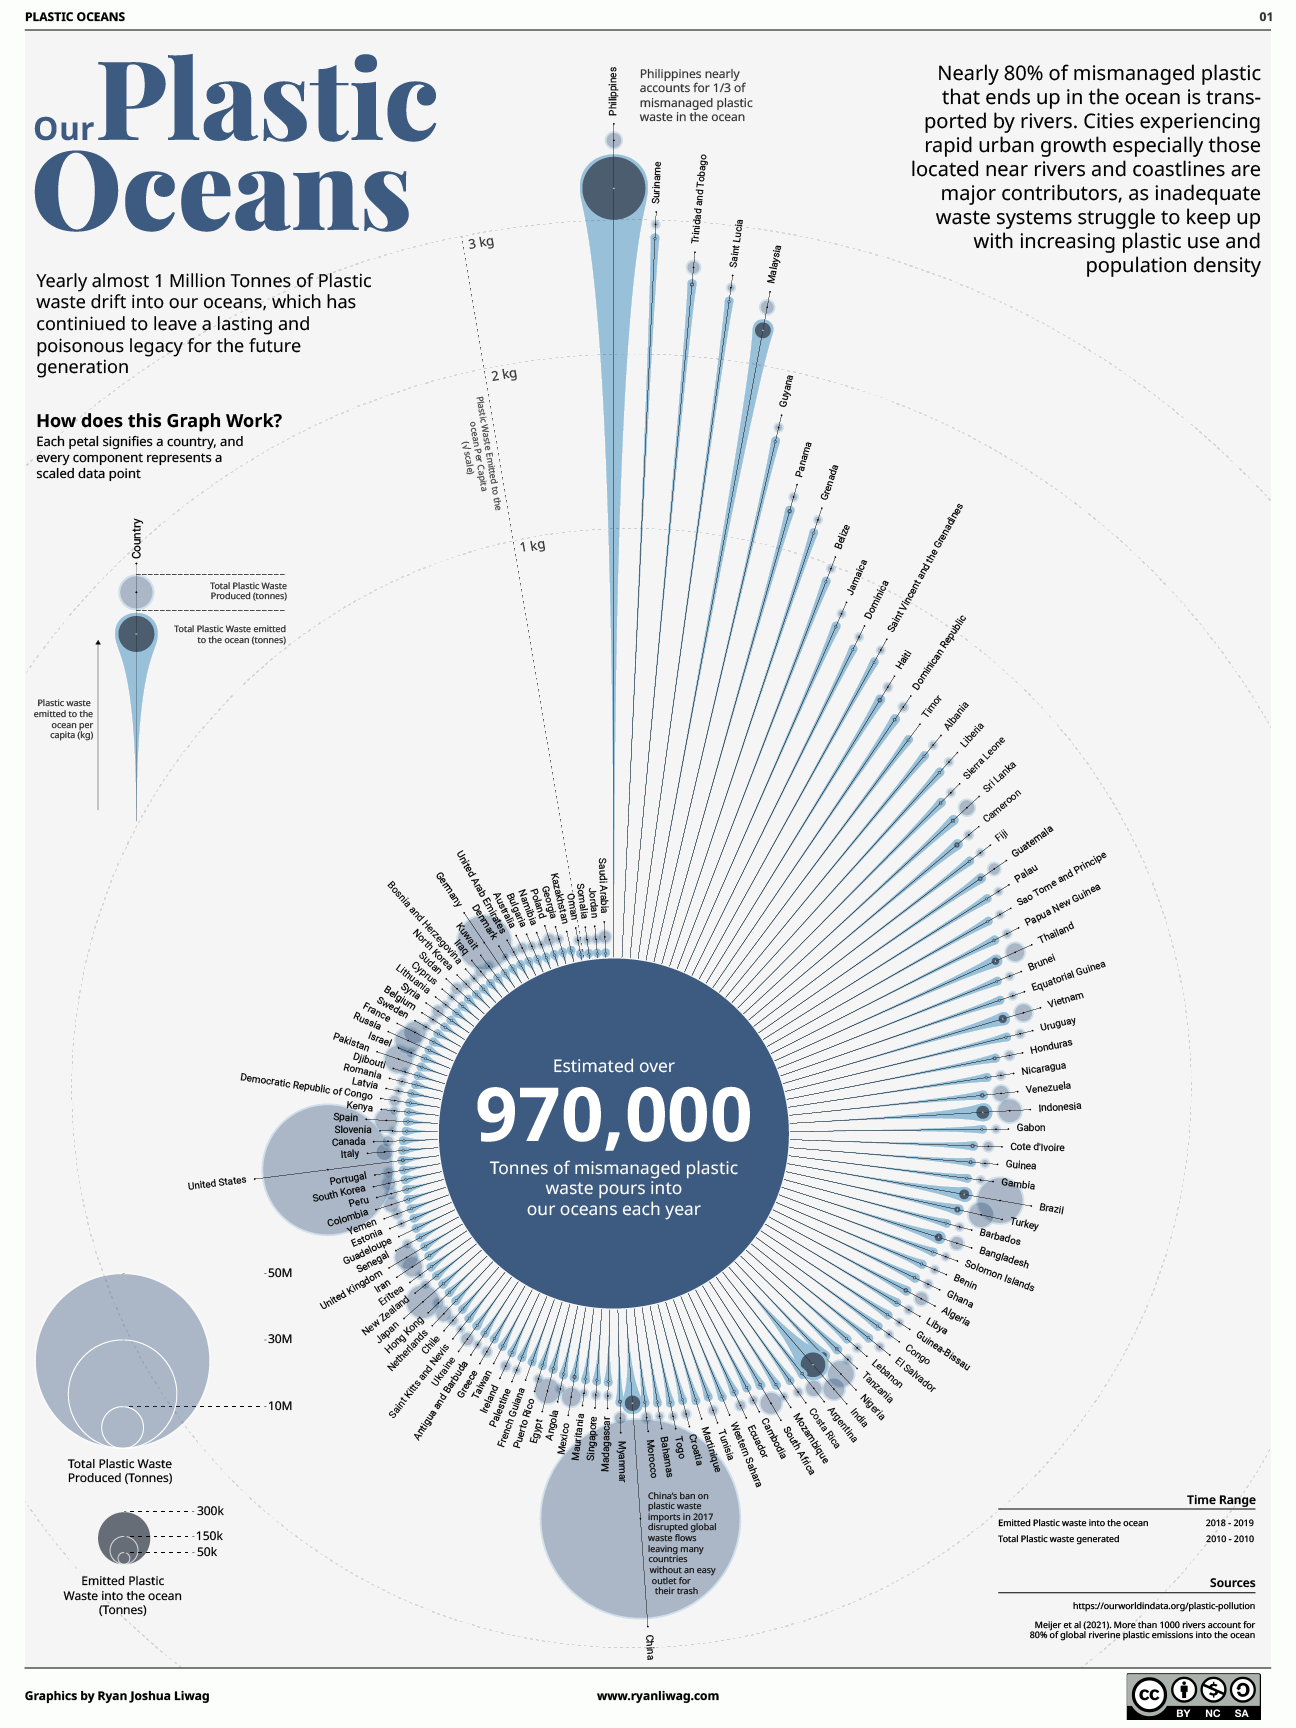
Commissioned charts, maps and data stories for newsrooms, NGOs and research teams.
Start a project →